VoltGuard AI
- Industry
- Energy & utilities · Albania
- Category
- AI Platform / Web Dashboard & Mobile App
- Platform
- React, React Native, Expo
- Status
- Built
Overview
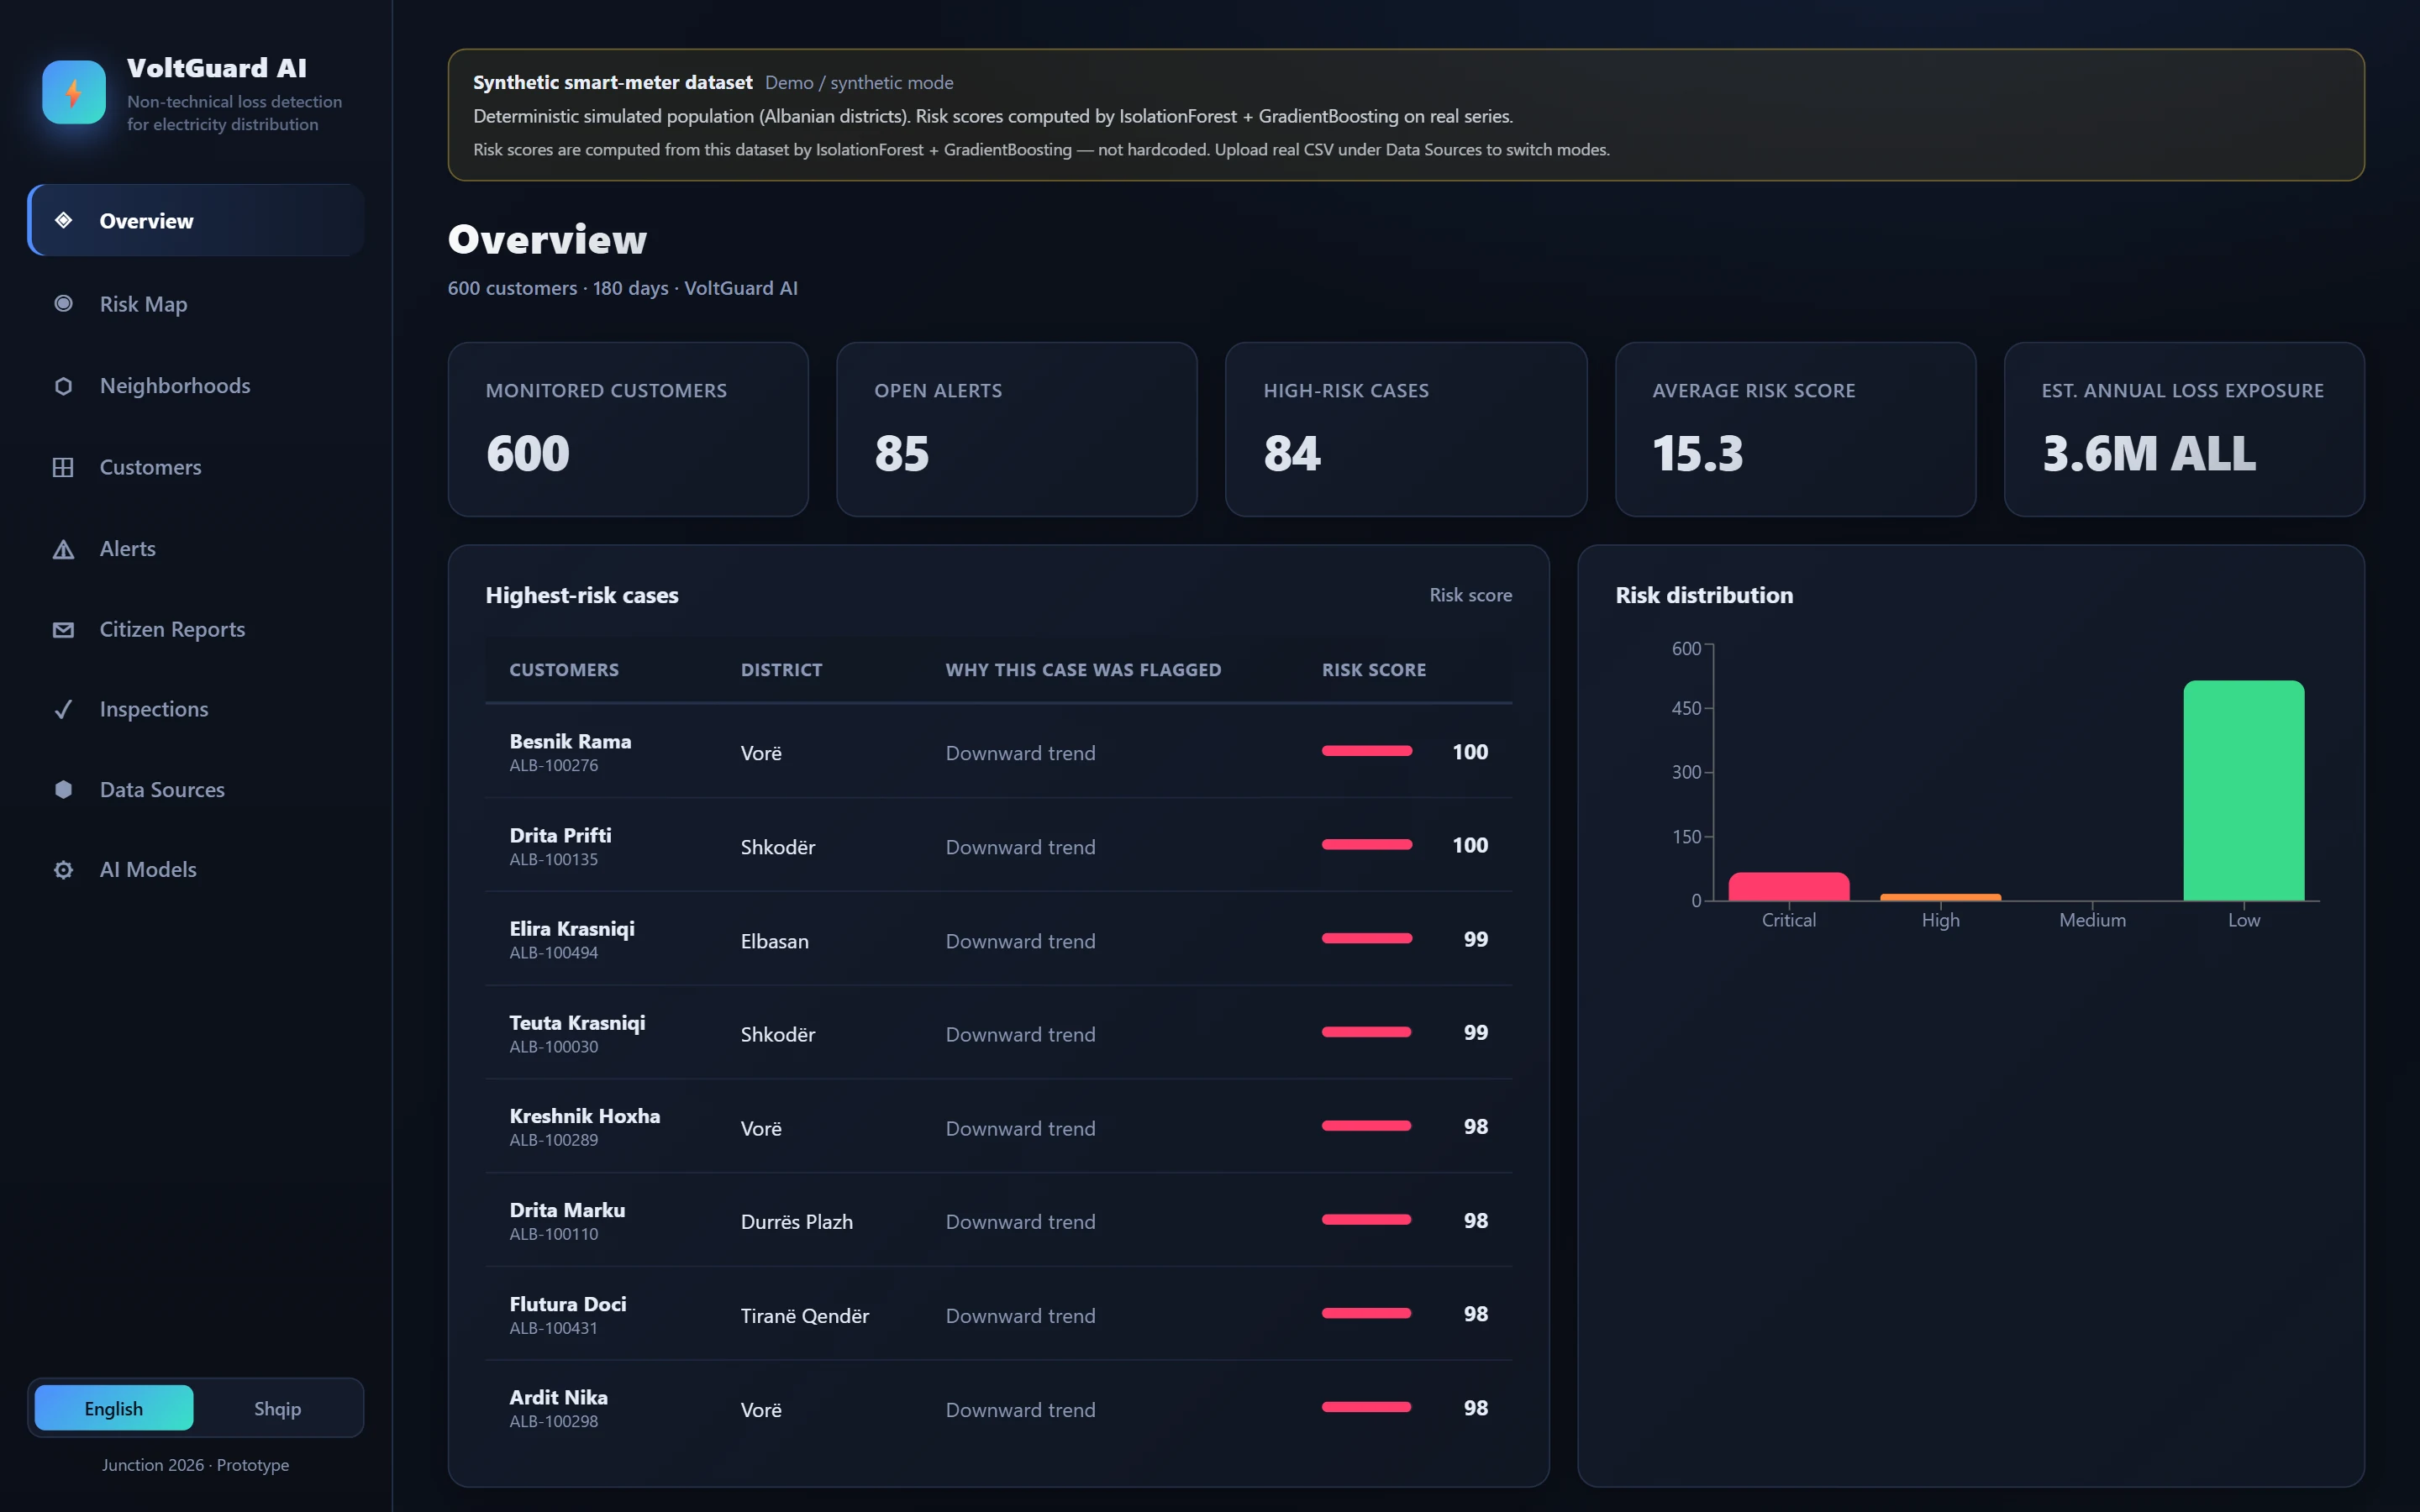
An AI platform that helps electricity distributors find meter tampering and illegal connections, with a dashboard for operators and an app for citizens and inspectors.
Non-technical losses, such as meter tampering, illegal connections and unusual consumption, cost electricity distributors money and are hard to spot one meter at a time. VoltGuard turns smart-meter data into a ranked list of what to check first.
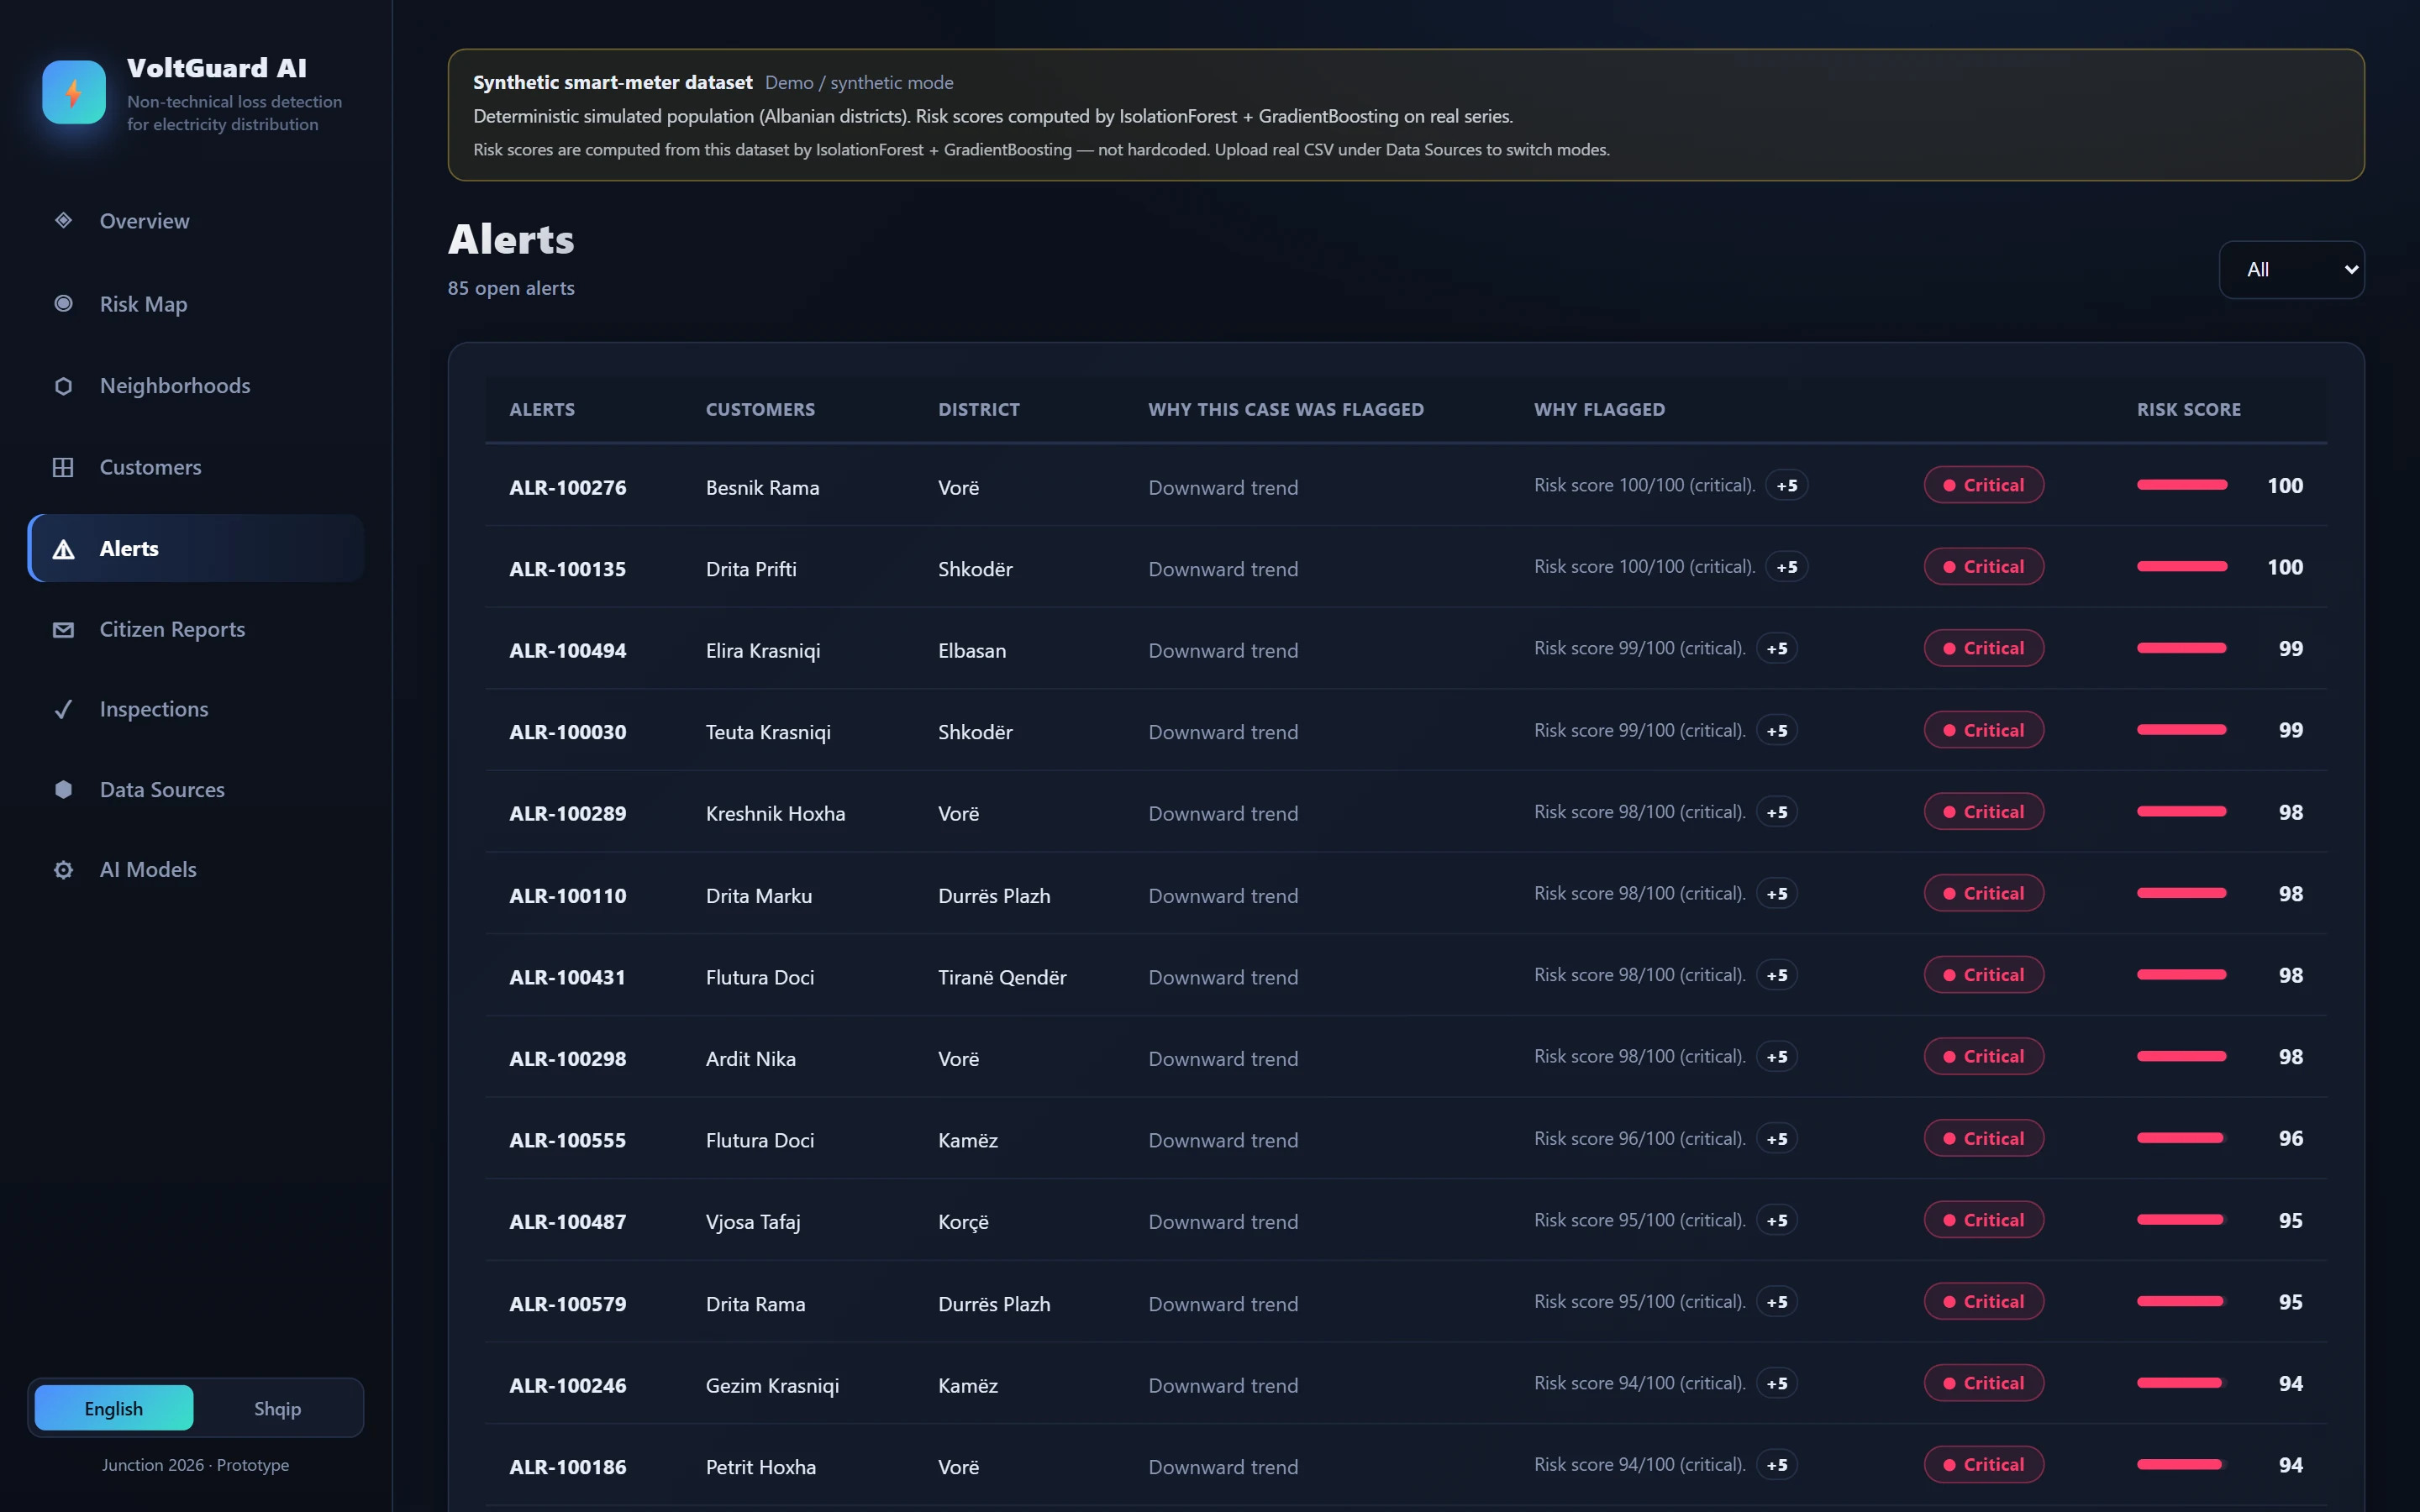
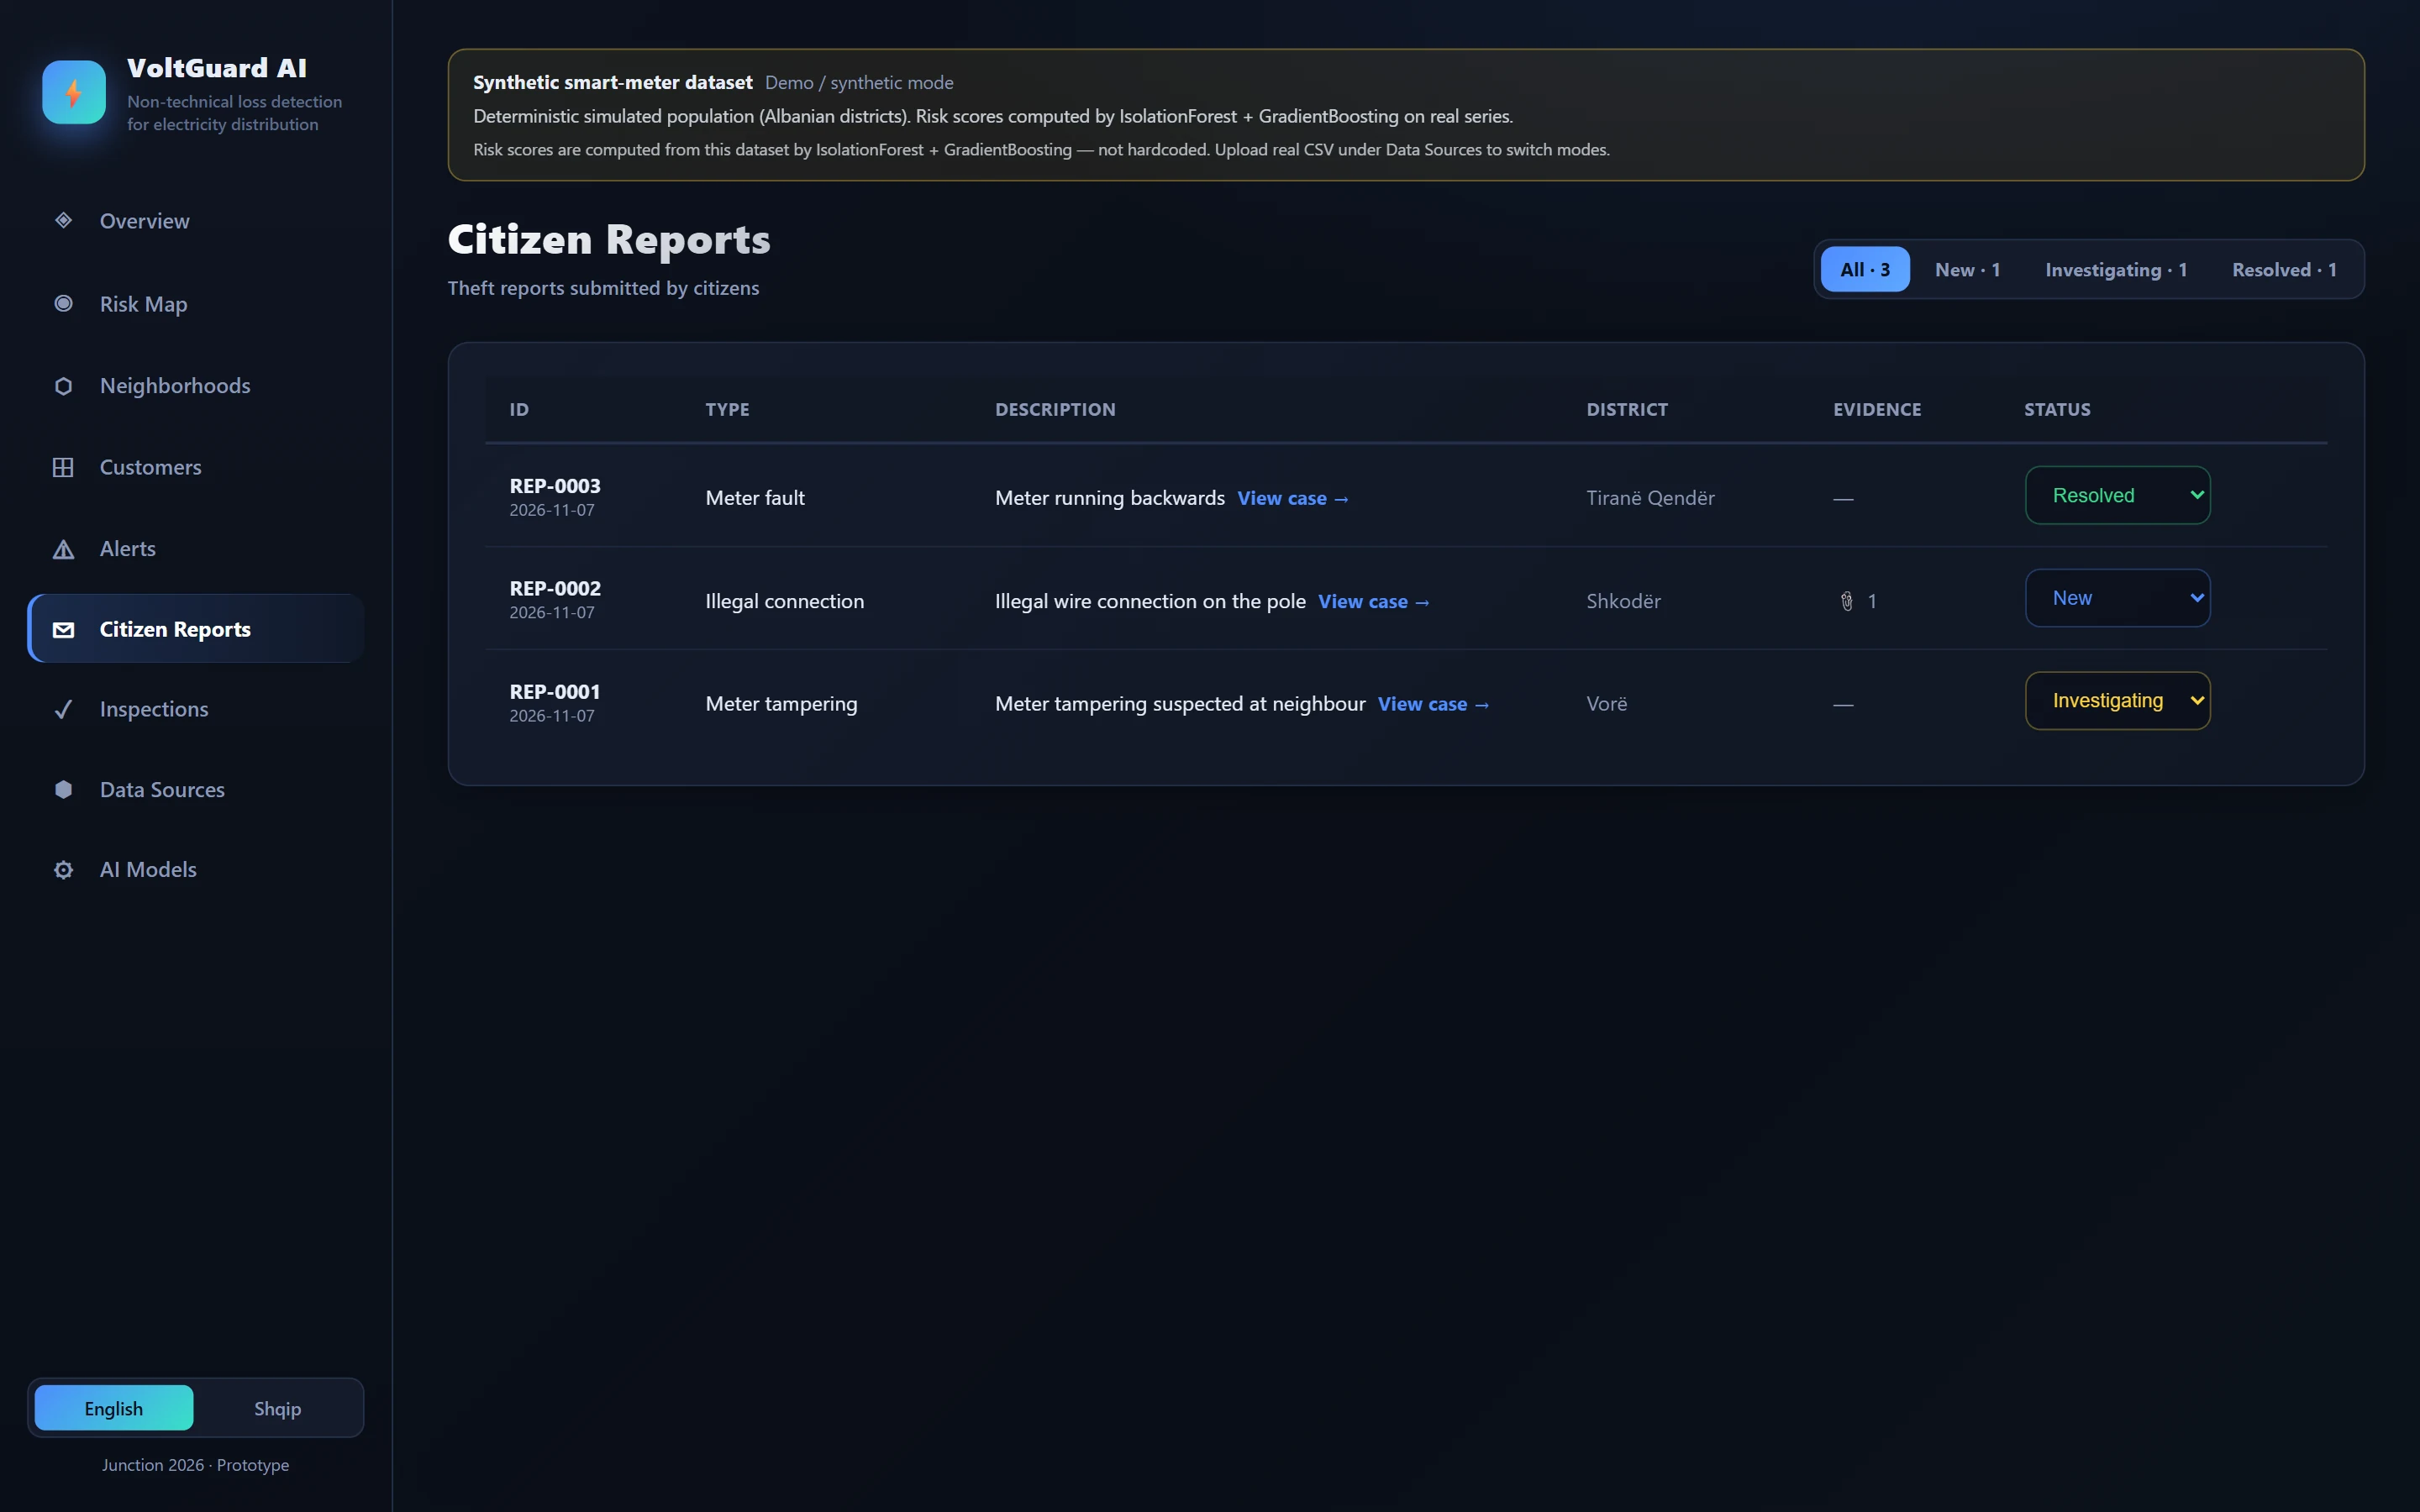
Operators work from a web dashboard with alerts, explainable risk scores and neighbourhood rankings. Citizens use a mobile app to follow their energy, predict their bill and report suspected theft, and inspectors handle flagged cases in the field.
The challenge
The challenge
A utility can only inspect so many homes. It needs to know which cases are worth a visit and why, and the people affected need something useful in their own hands.
Objectives
- 01Rank customers and neighbourhoods by risk
- 02Explain why each case was flagged
- 03Let citizens report suspected theft with evidence and follow its status
- 04Give inspectors a clear queue and route
Strategy & approach.
- 01 — Strategy & approach
One platform with separate experiences for each role. The operator gets density and detail, the citizen gets clarity and advice, and the inspector gets the next visit, all from the same data.
- 02 — Design
A dark, data-first dashboard for long sessions at a desk, and a bright, friendly mobile app with large numbers and simple actions. Both work in English and Albanian.
- 03 — Technical implementation
A FastAPI backend combines Isolation Forest anomaly detection, gradient boosting and K-Means clustering into one explainable risk score. The dashboard is built with React, and the mobile app with Expo and React Native.
On desktop
What we built
What we built.
- 01
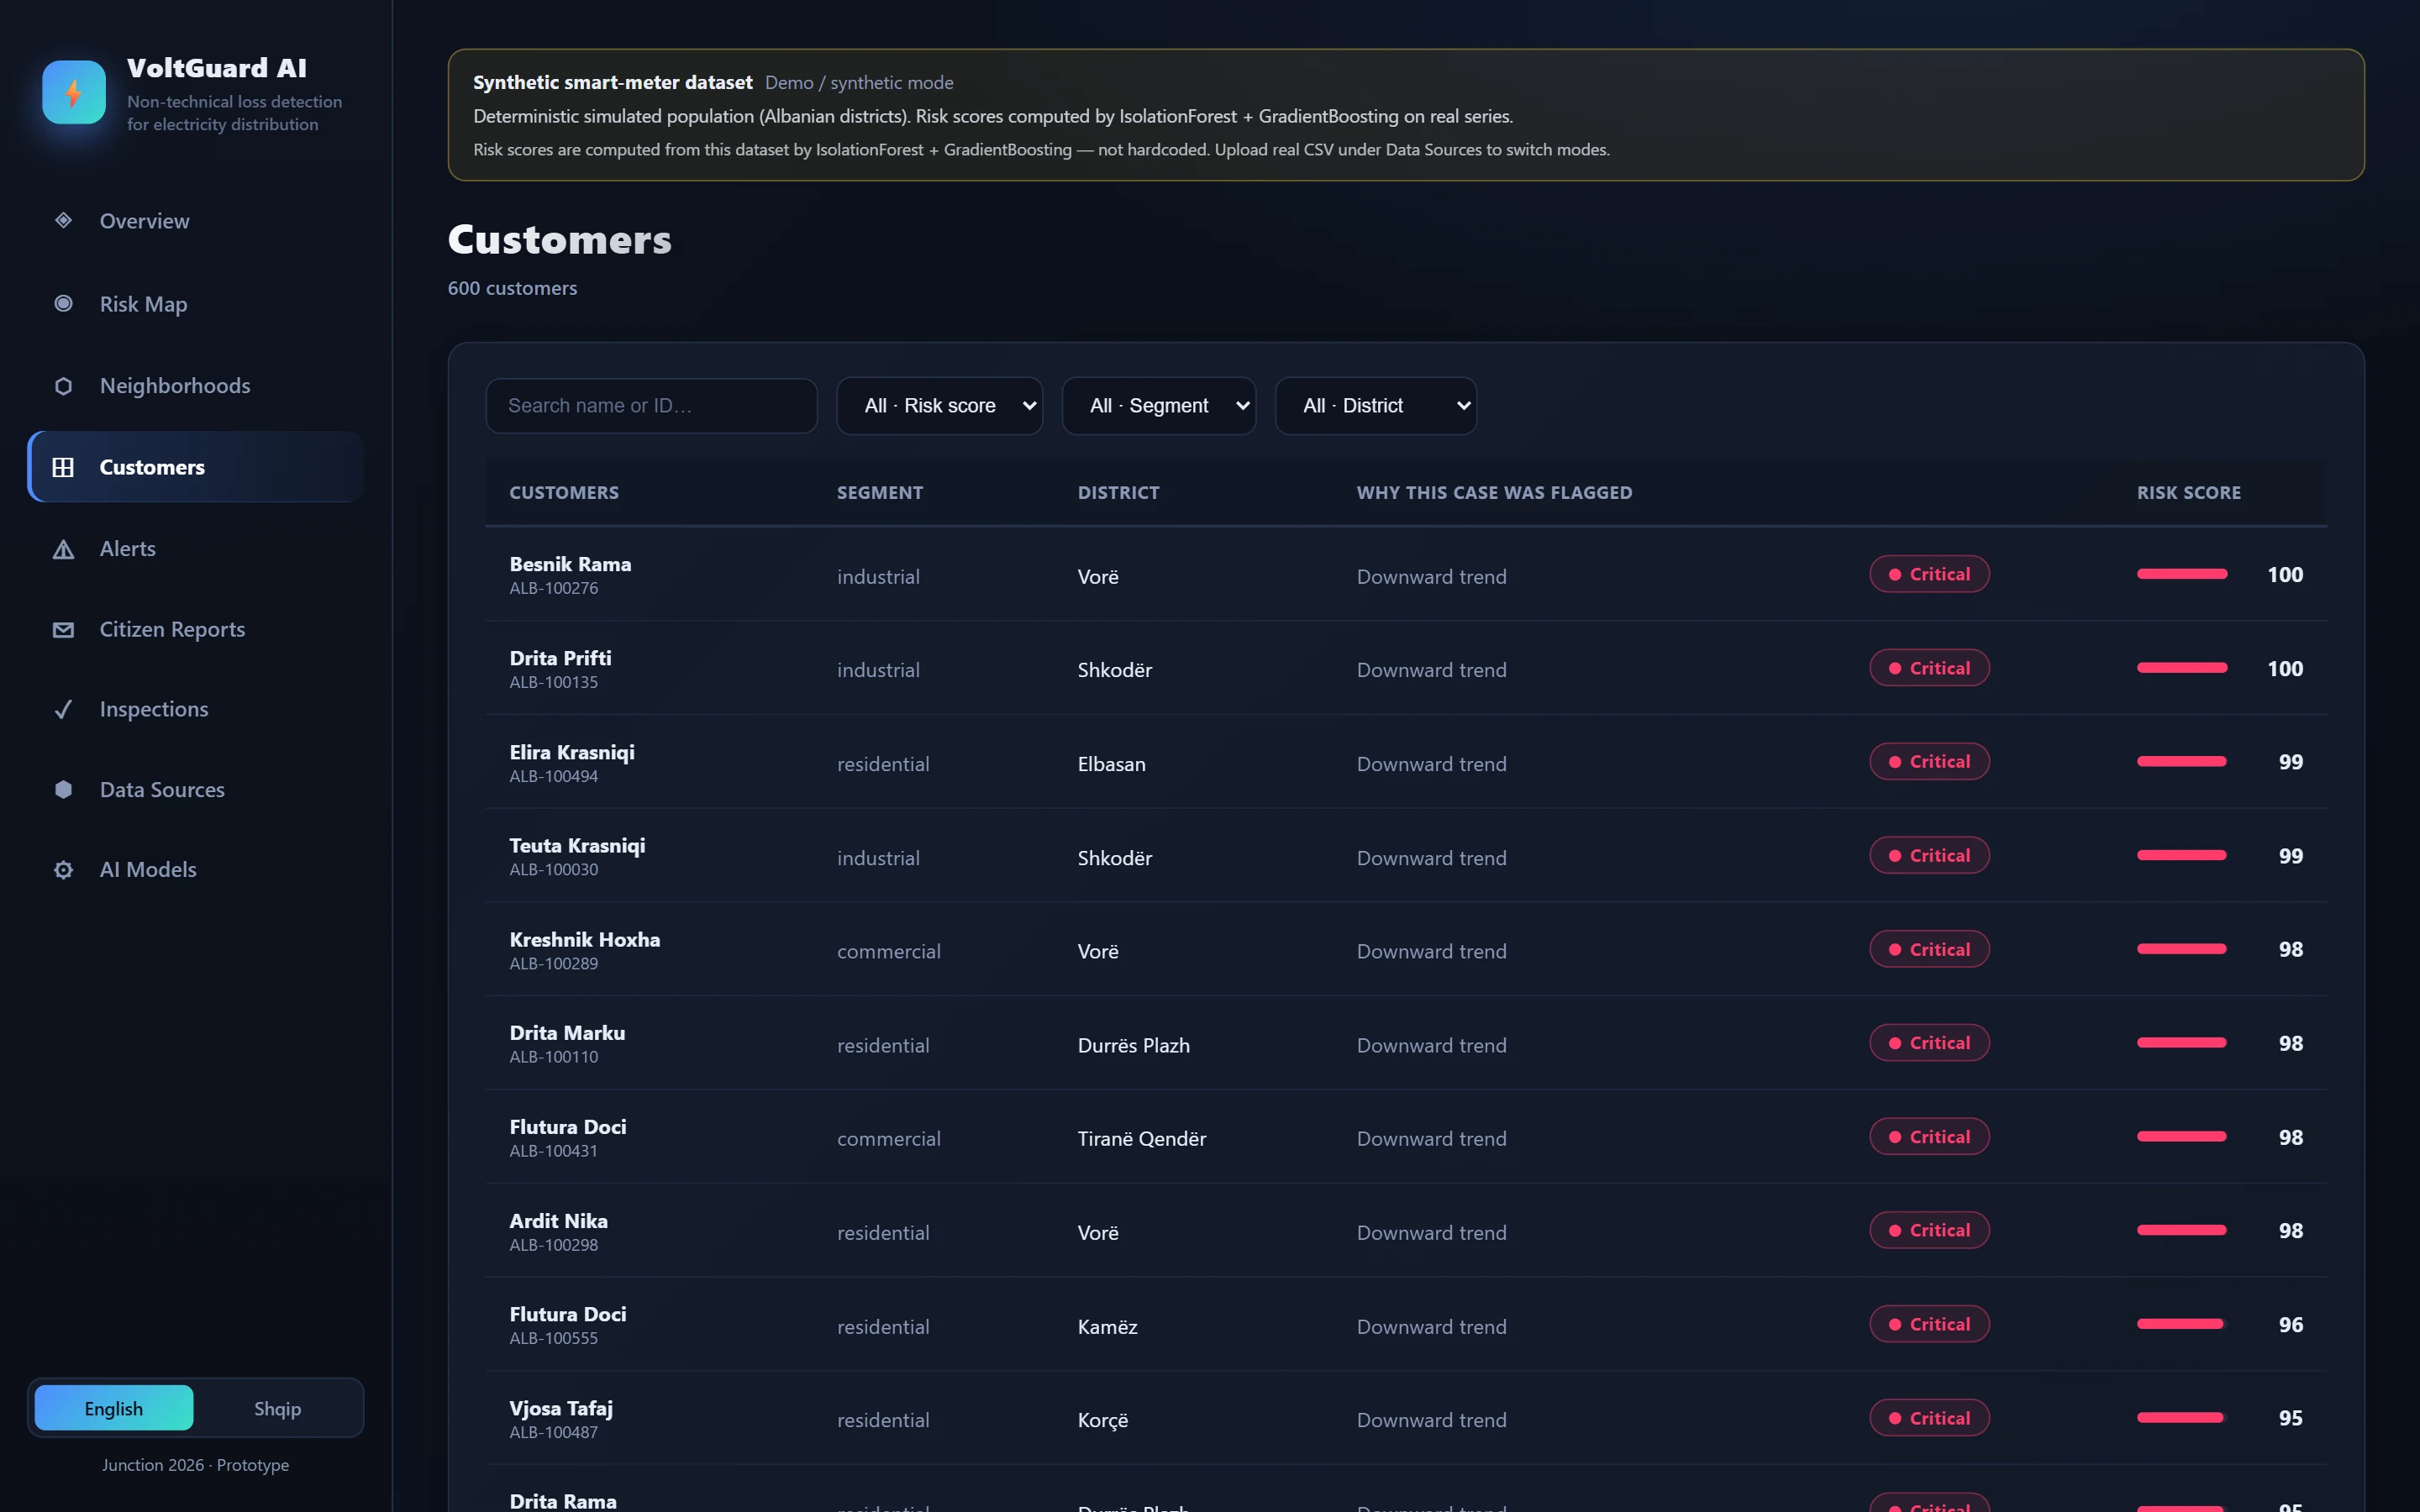
Explainable risk scores
Every customer gets a score from 0 to 100, with the reasons it was flagged shown next to it.
- 02
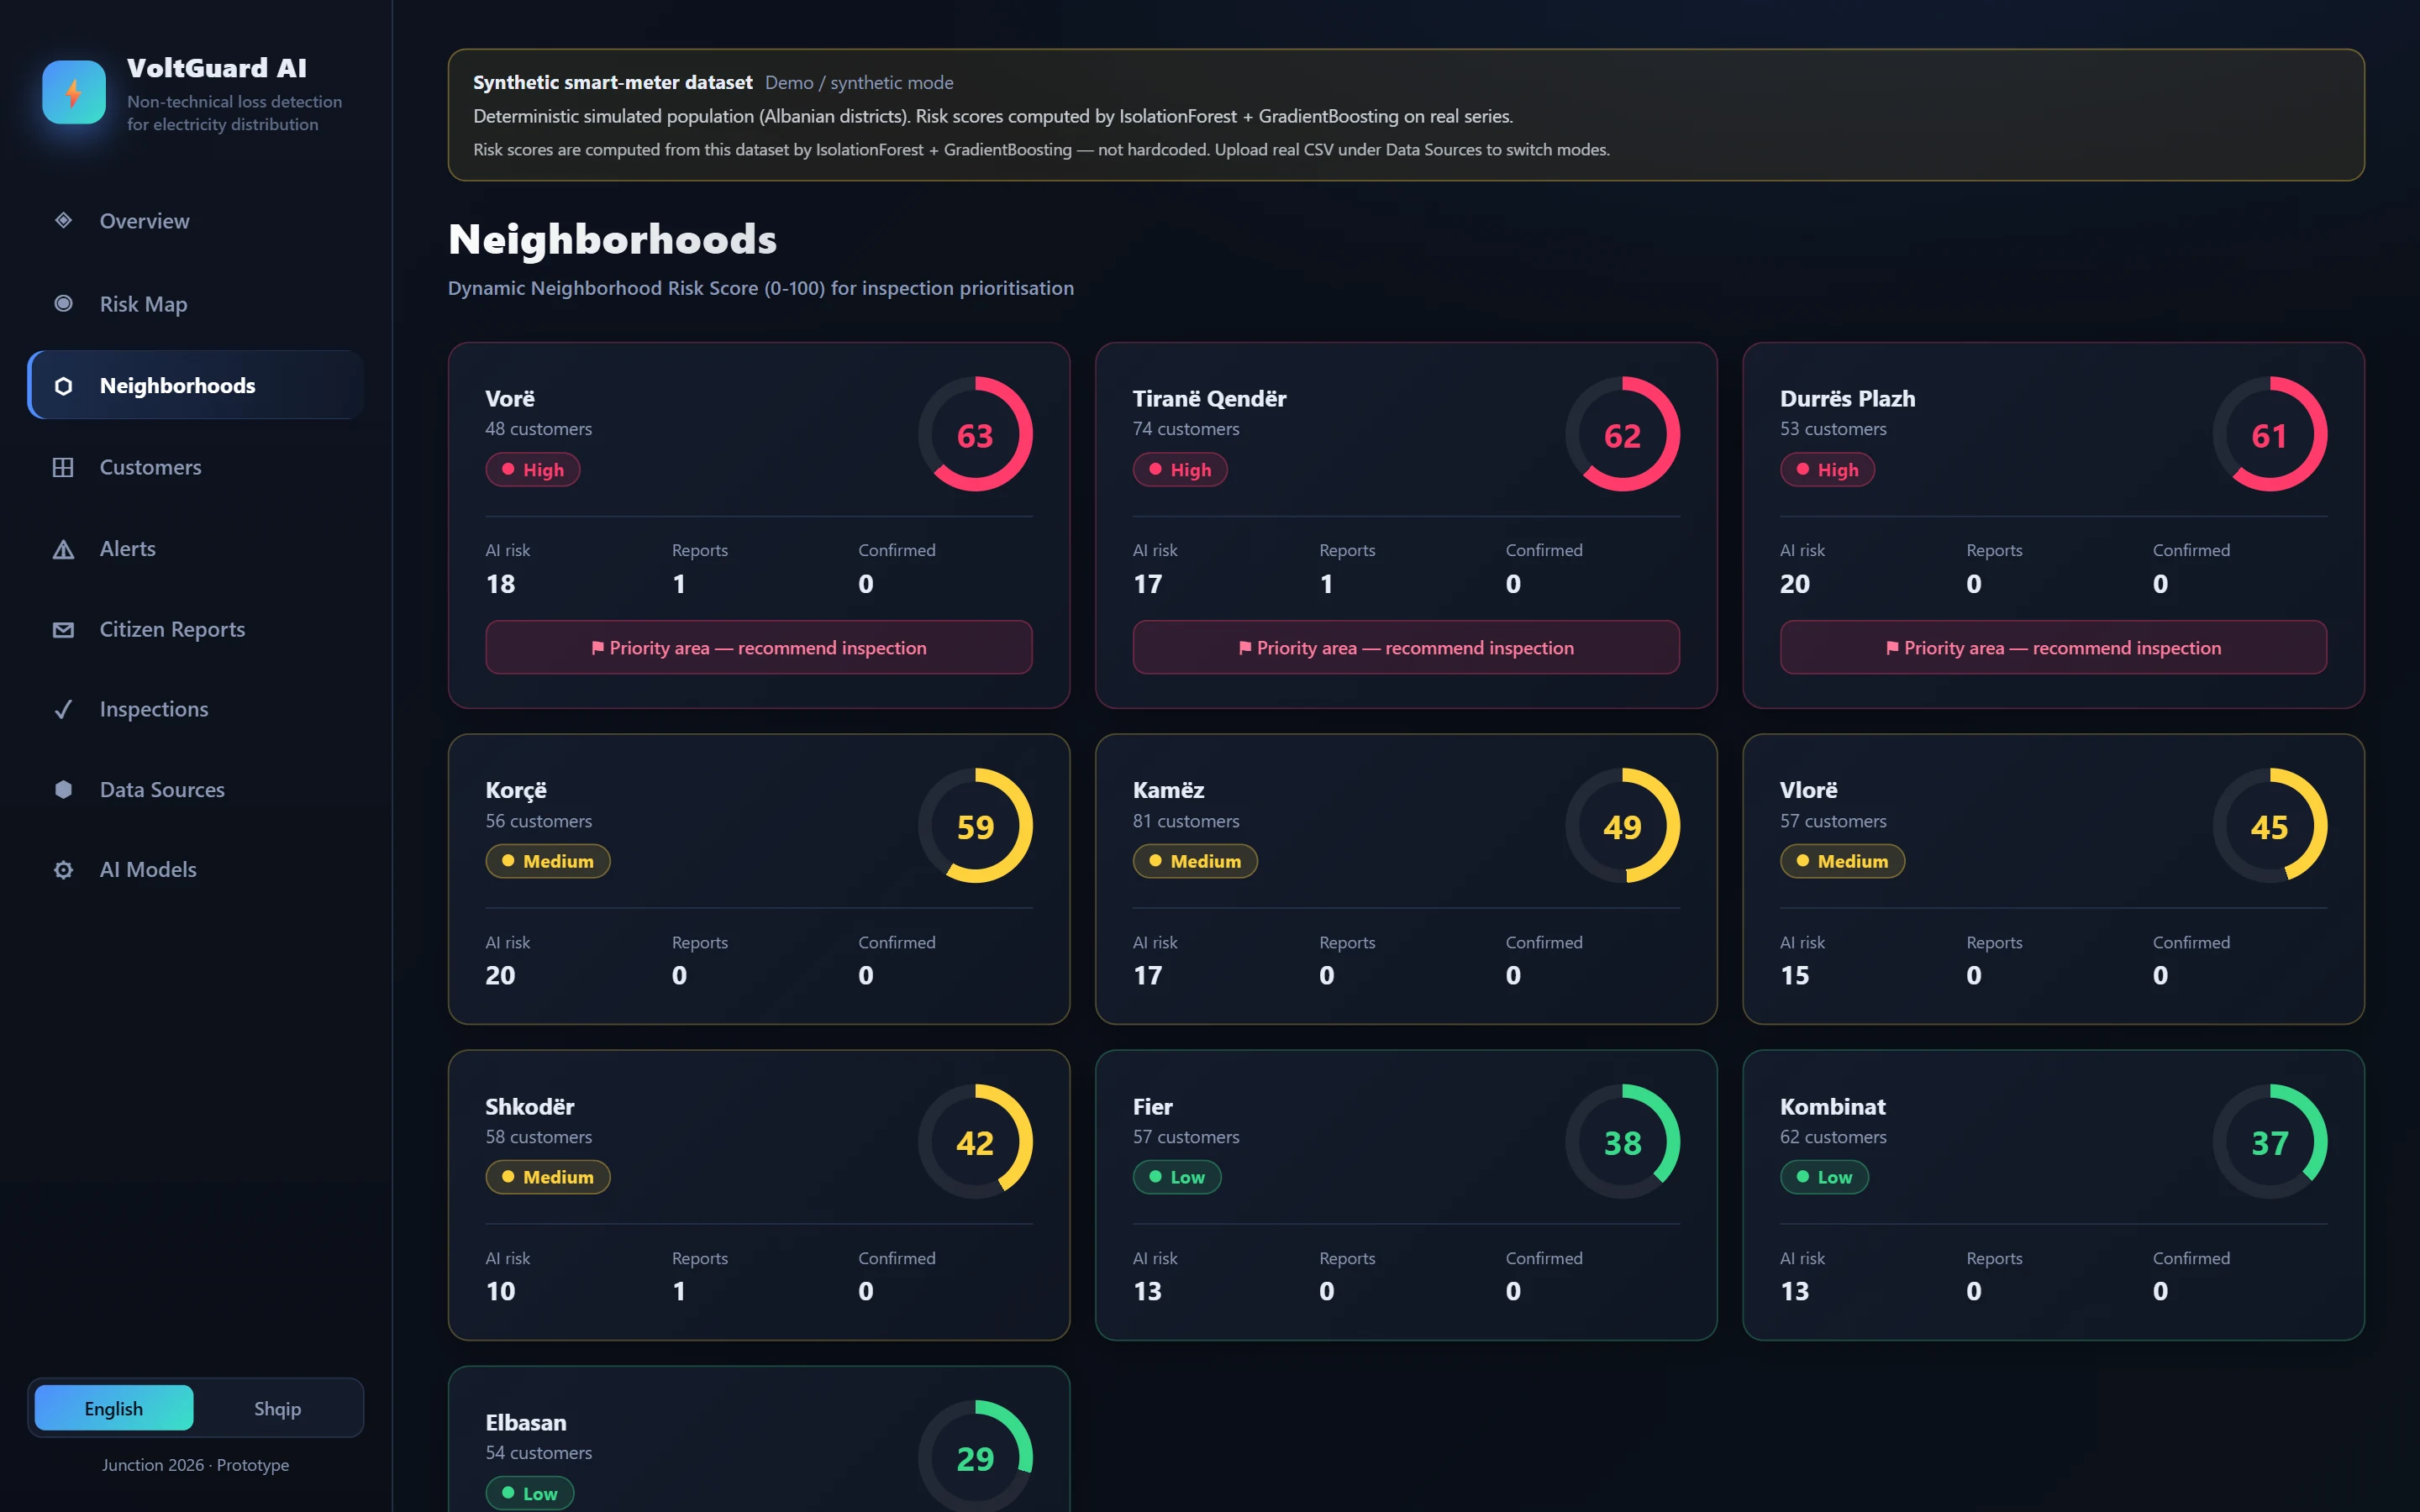
Neighbourhood ranking
Districts are ranked by risk, so inspections can start where they are likely to matter most.
- 03
Citizen energy app
Live power, a predicted bill, usage trends, a cost calculator and a personal AI assistant.
- 04
Theft reporting
Citizens report what they saw, add photo or video evidence, and track the report's status.
- 05
Inspector workflow
Priority visits, an optimised field route, and case details for each inspection.
- 06
Bilingual
The dashboard and the app both work in English and Albanian.
On mobile
Designed for the phone first.
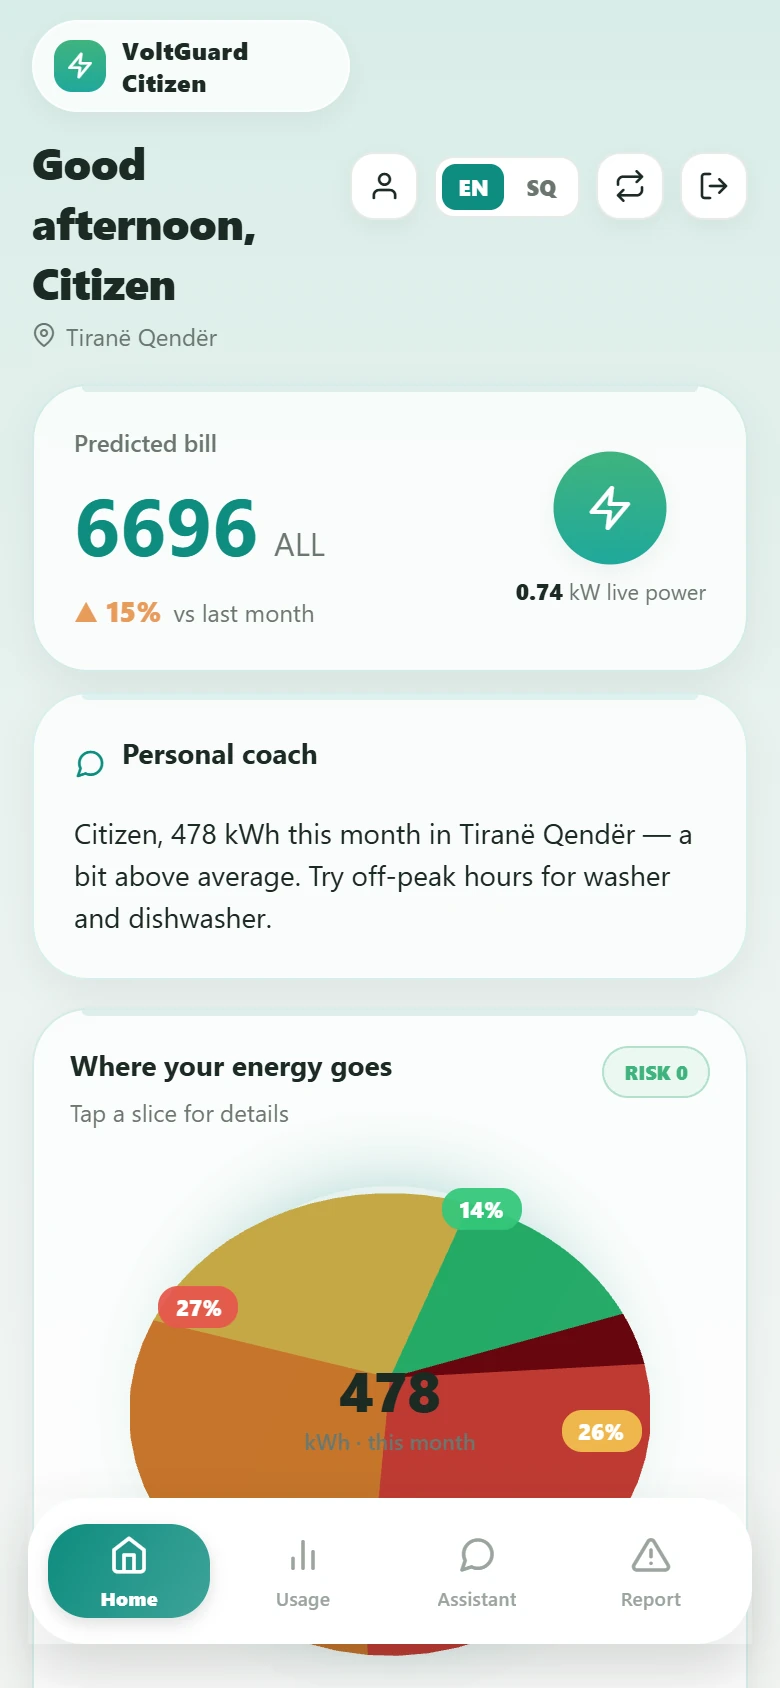
Citizen home with predicted bill and live power
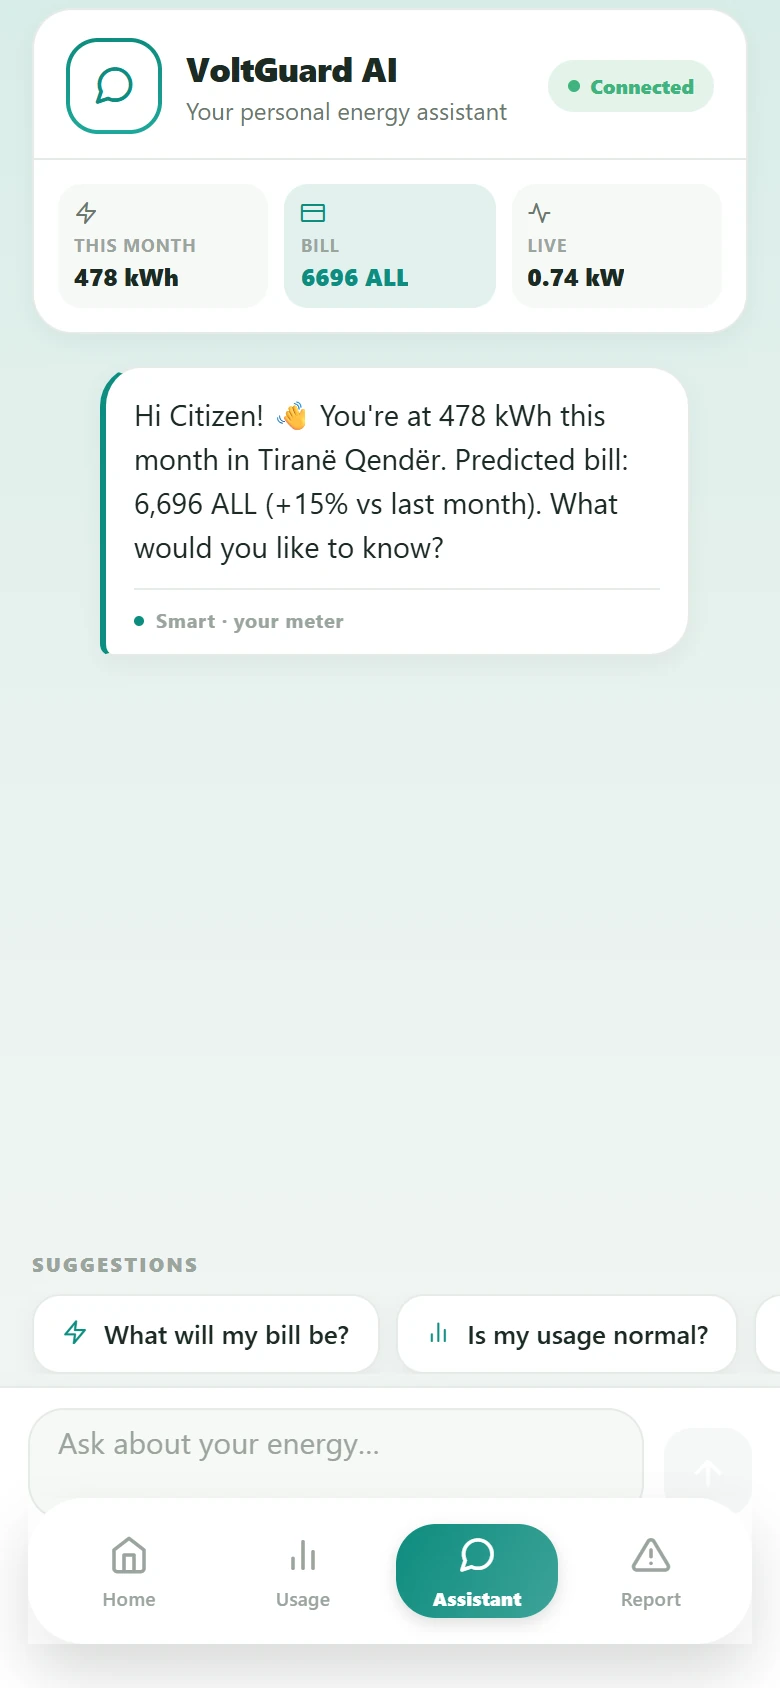
AI assistant answering from the citizen's own meter
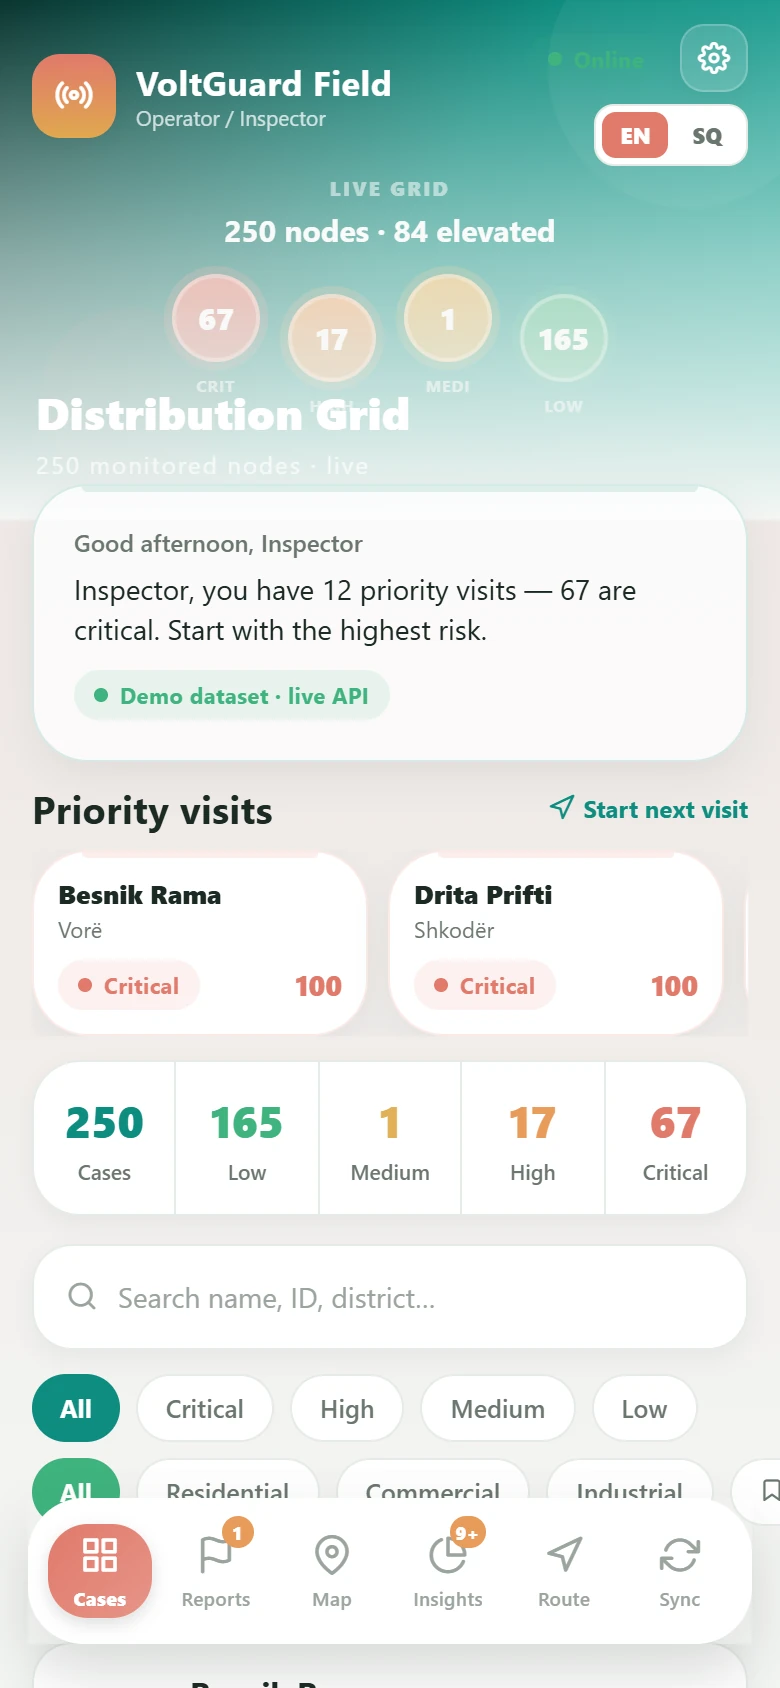
Inspector app with live grid status and priority visits
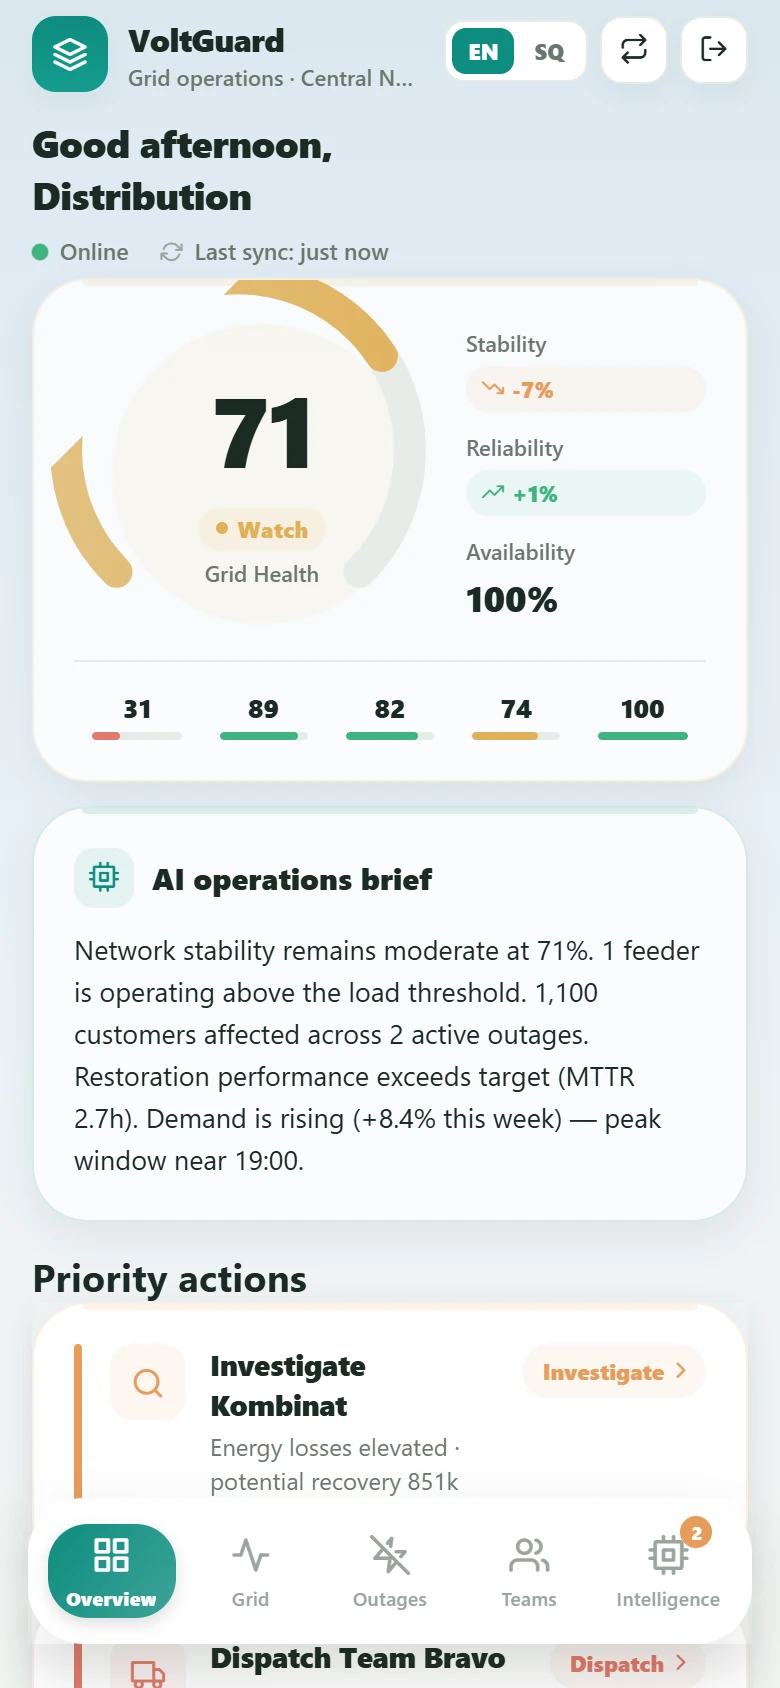
Grid operations with grid health and an AI brief
Built with
Built with
- React
- React Native
- Expo
- FastAPI
- Python
- scikit-learn
- TypeScript
Related work
Related work.
Civic technology · Mobile Applications
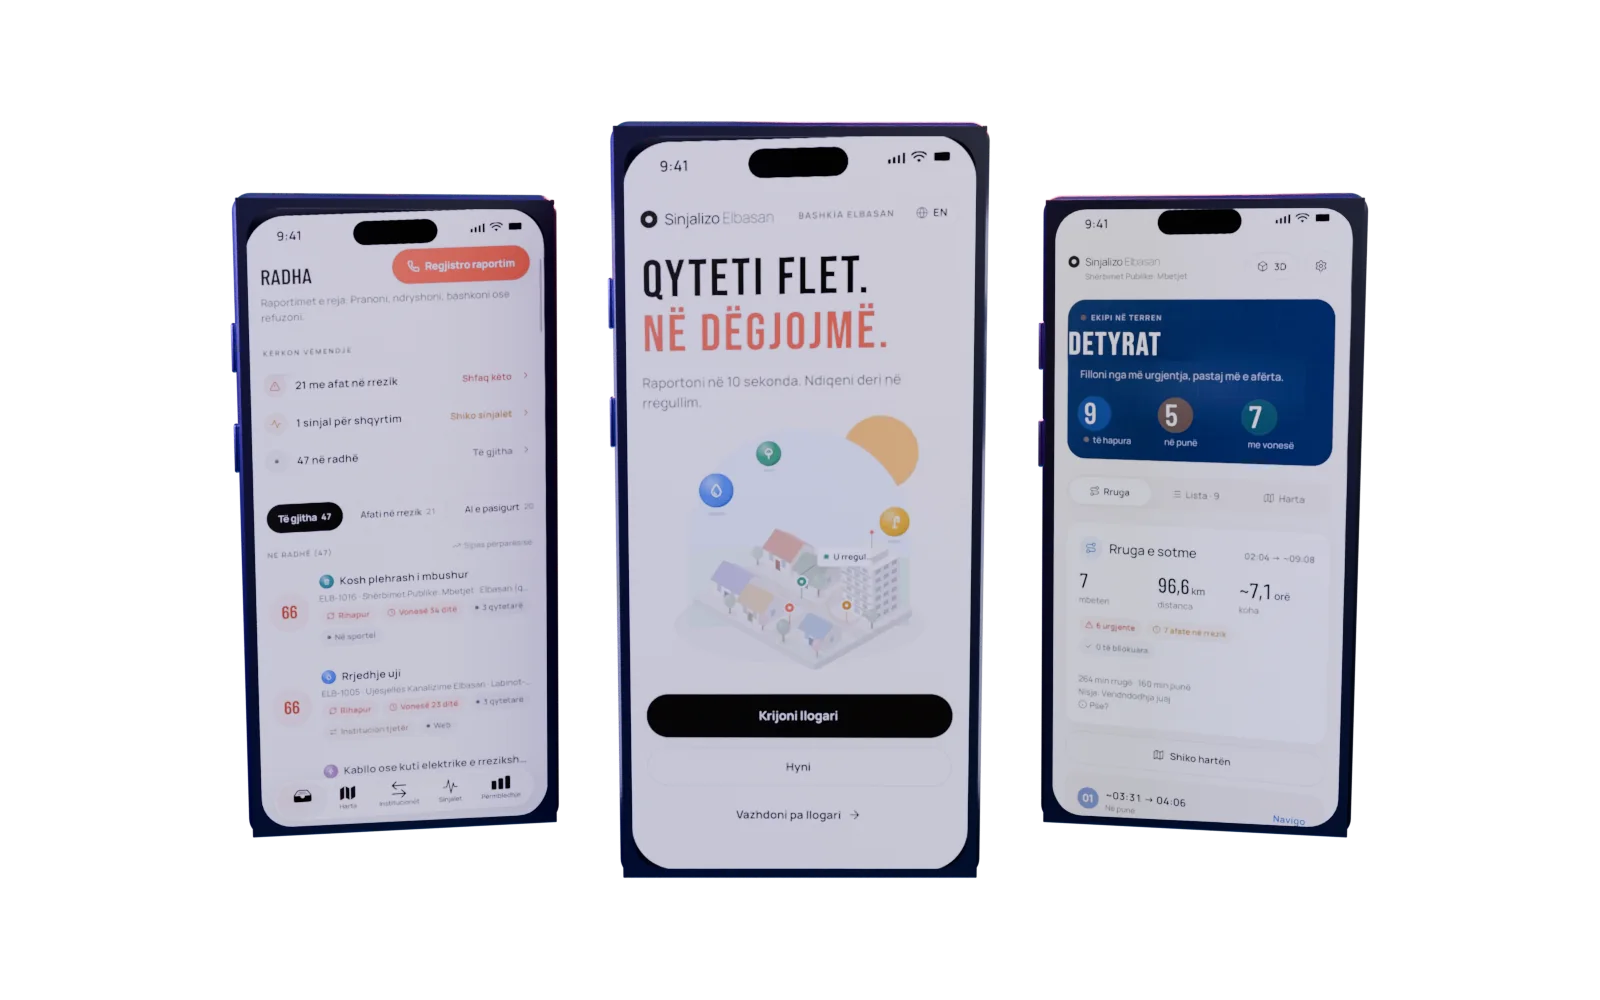
Sinjalizo Elbasan
A city reporting system for Elbasan. Citizens report a problem with one photo, the municipality triages it with AI help, and field teams fix it and verify the result.
Mobile · SaaS · Mobile app · AI categorisation
Driving school · SaaS Platforms
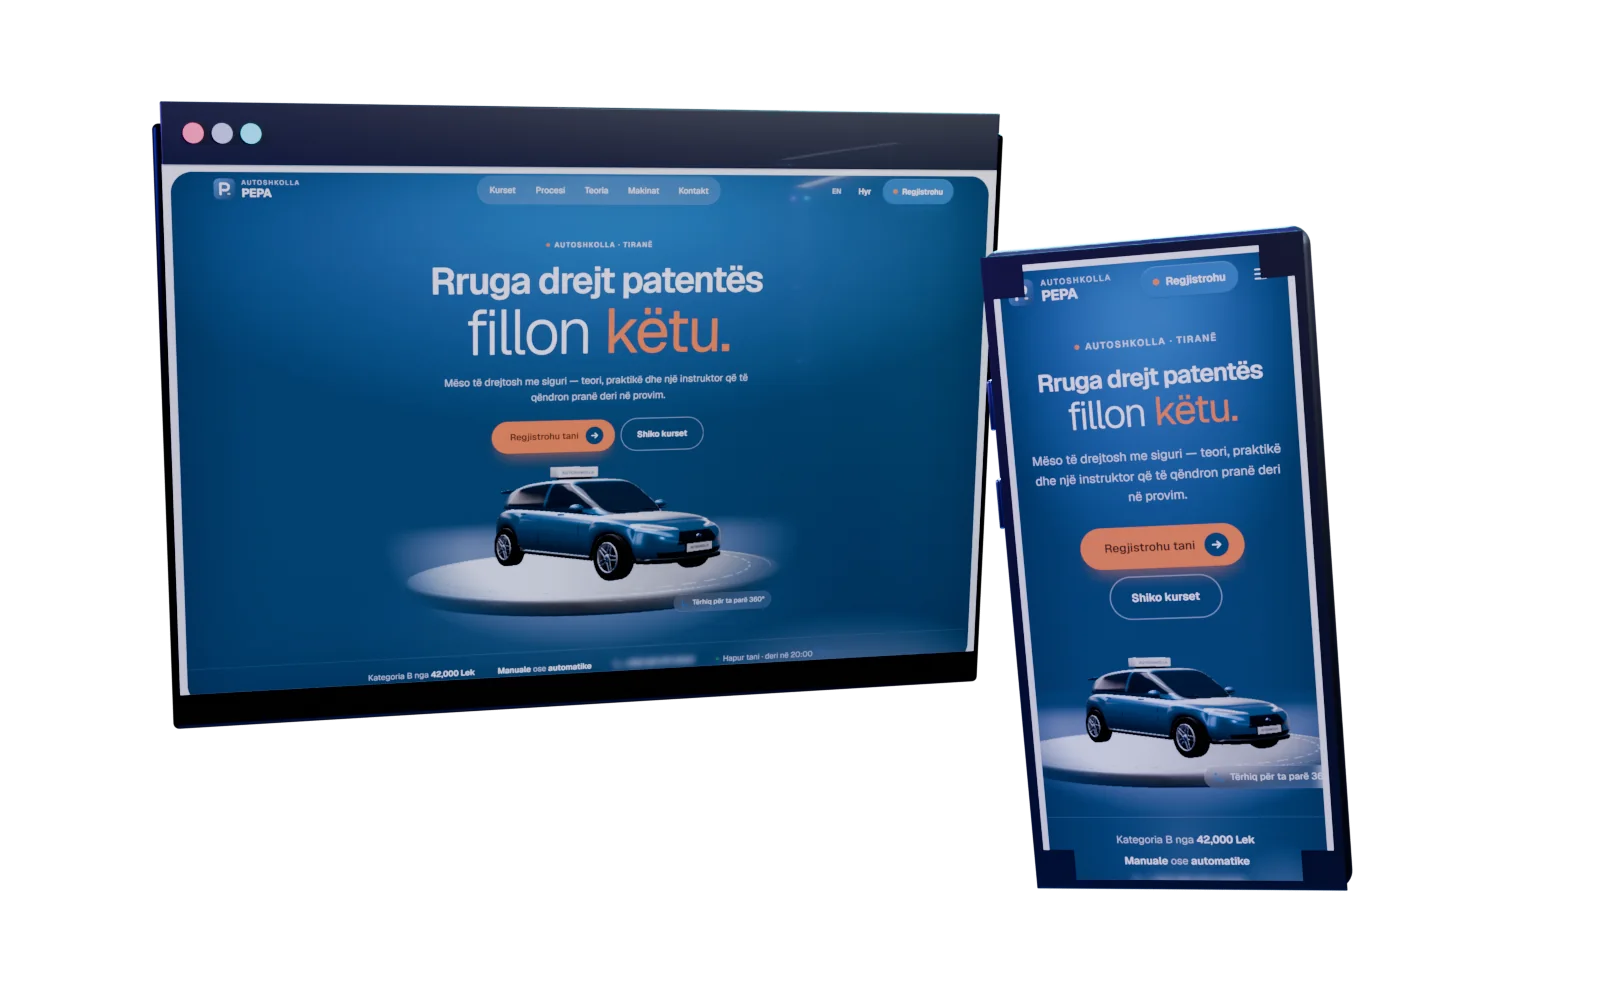
Autoshkolla PEPA
A complete platform for a driving school: an interactive 3D website, online registration, and portals for students, instructors and the owner.
Custom · SaaS · Next.js · React
Barbershop · Corporate Websites
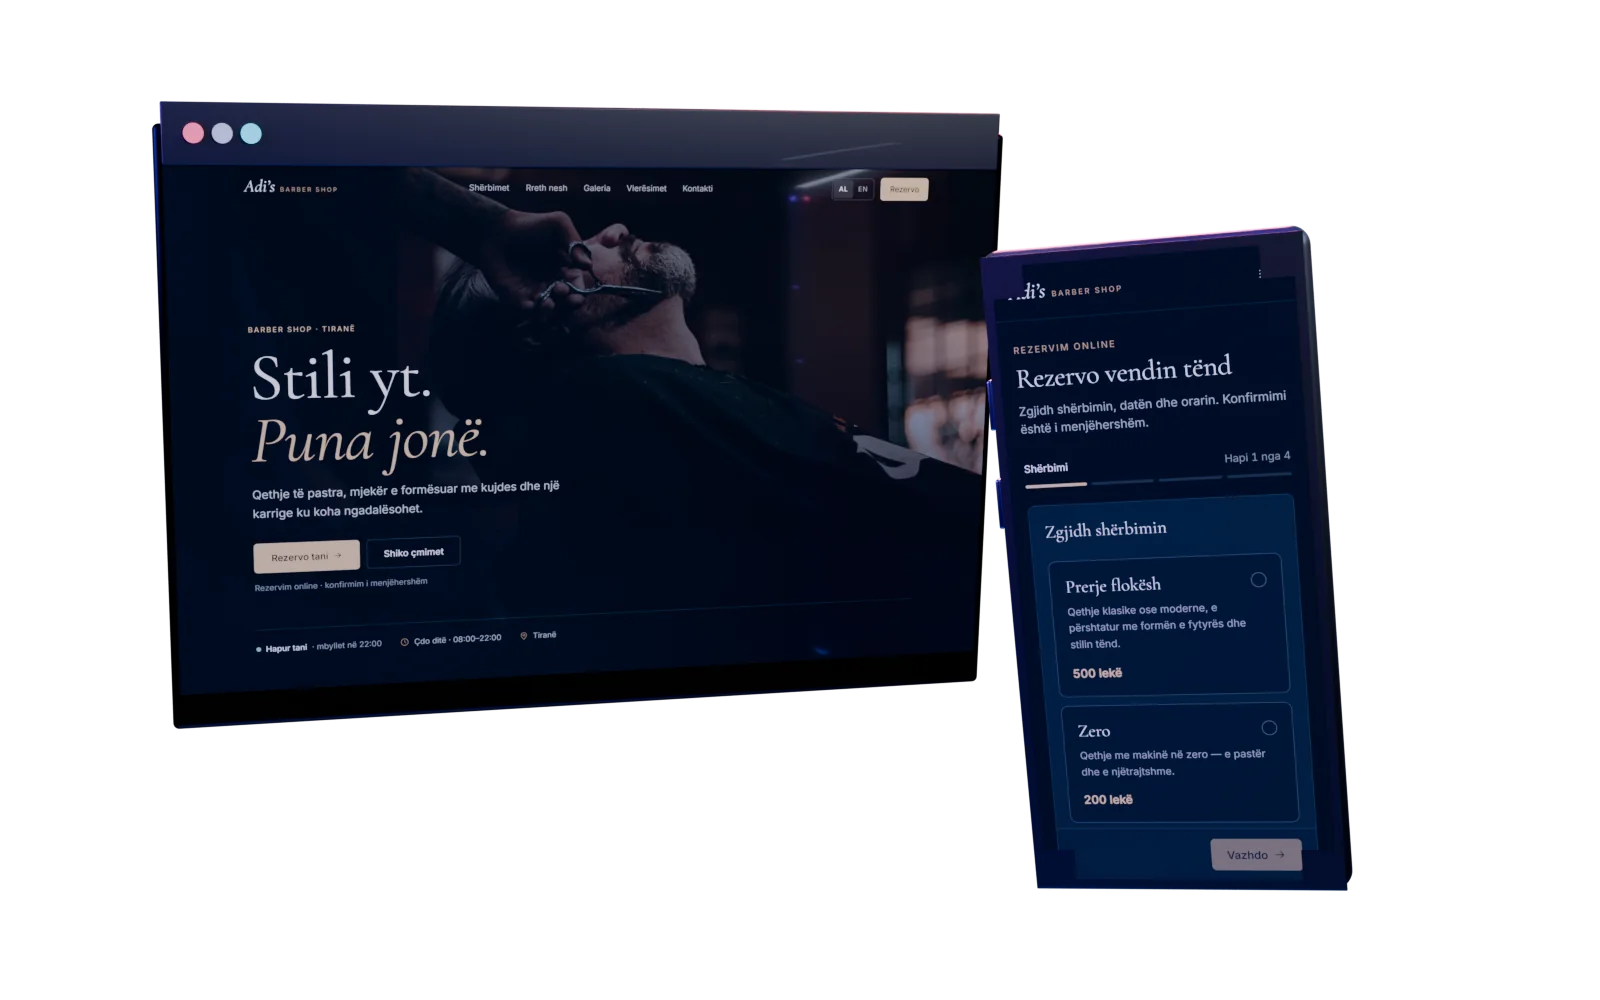
Adi’s Barber Shop
A dark, editorial website for a Tirana barbershop — with a full service menu and its own online booking flow.
Custom · Business · Next.js · React
Next project — 04
Sinjalizo Elbasan
Mobile App / City Reporting Platform